
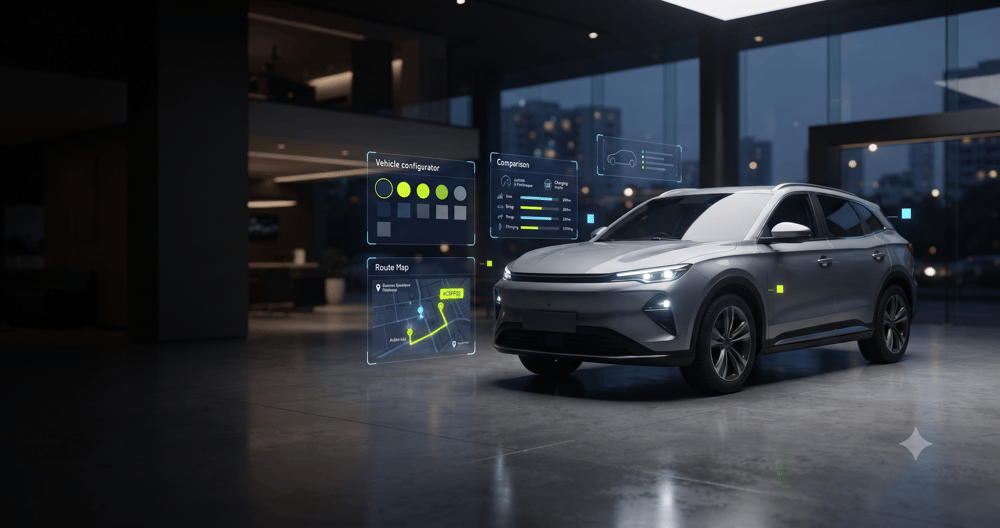
A buyer spends a Tuesday night comparing two SUV variants. They build one in the configurator, open the EMI calculator, and leave at the accessories step. Four days later they return from a YouTube review. A standard automotive site greets them with the same homepage it shows everyone else.
63% of recent car buyers in India say they decided on their final brand during active research (Google-Kantar, 2026).
That research runs across search, video, AI answers and your own website, and every step leaves a signal. Data-driven UX lets those signals shape what the interface shows next. This post covers the numbers behind the shift, the signals worth acting on, the interface changes they should trigger, and how to build and measure the layer.
What is data-driven UX in automotive?
Data-driven UX is the practice of using observed buyer behavior to decide what an interface shows, in what order, and with which next step.
- Inputs: clickstream, configurator and calculator interactions, search and filter use, dealer locator activity, return visits and source of arrival.
- Outputs: layout, content order, calls to action and dealer handoff that change with the signal.
- Versus A/B testing: testing compares two fixed designs. Behavioral design adapts one design to each buyer's stage.
- Versus demographic segmentation: a signal reflects what the buyer is doing now, which tells you more about intent than who they are.
- Non-linear by default: Google-Kantar's 2026 study of 1,022 recent car buyers in India's metros and Tier 1 cities (fieldwork May 2026) found three in four casually explore automotive content before entering the market, and 63% decided their final brand during active research. Deloitte's 2026 India study agrees that digital research now dominates the purchase journey.
- More sources, more signal: 93% of those buyers used AI surfaces during active research, and buyers who used AI averaged 7.8 touchpoints against 6.9 for buyers overall. 80% of AI chatbot users also used Google Search or YouTube.
- Shared decisions: partners influenced the final decision for 53% of buyers, and other family members collectively for 64%. A saved build often has more than one audience.
- Hybrid is the expectation (US): in Cox Automotive's 2025 study of 2,344 recent US buyers, 63% said their ideal experience mixes online and in-person steps, and only 7% bought entirely online. The handoff between website and dealer is part of the experience.
- Personalization is expected (cross-sector): McKinsey's 2021 survey found 71% of consumers expect personalized interactions and 76% get frustrated when they do not receive them.
Which behavioral signals should an automotive interface act on?
Start with signals that reveal stage and intent: what the buyer compared, configured and calculated, and where they stopped.
- Comparison depth: two variants of one model suggests a buyer narrowing down. Several models suggests early research.
- Configurator behavior: variants, colors and accessories chosen, and the step where the build was abandoned.
- Finance and EMI calculator use: a budget-led buyer who needs cost clarity before specifications. Finance is also where expectation and supply diverge most: 48% of US buyers wanted to apply for credit online but 33% did (Cox Automotive, 2025).
- EV-specific interest: views of range, charging and cost-of-ownership content. EV buyers leave a richer trail, with 76% using digital tools in the buying process against 42% of gas-powered car buyers (Cox Automotive, 2024, US).
- Dealer locator and test drive activity: the closest on-site signal to a showroom visit.
- Return visits and source: whether the buyer arrived from search, social, an AI answer or a dealer referral. Source shapes intent: around six in 10 Indian buyers said YouTube helped shape their initial consideration set, against 34% for manufacturer websites (Google-Kantar, 2026).
- Weak signals to deprioritize at first: raw time on page and single scroll-depth events.
How should the interface change in response?
Each signal should trigger a specific, pre-agreed interface change, so the design stays explainable and testable.
- Repeat visitor comparing two variants: bring a side-by-side view and a test drive prompt to the top of the page.
- Configurator abandoned at accessories: restore the saved build on return and offer a clear price summary.
- Heavy EMI calculator use: lead with finance options and total cost of ownership.
- First-time visitor from social: show the model hero, a short video and one exploring call to action instead of a form.
- Dealer locator opened: pass the saved configuration to the dealer, so the showroom conversation starts where the website ended. Cox Automotive found buyers who completed key steps online saved an average of 42 minutes at the dealership (2024, US).
- Build shared with family: let the buyer send the saved configuration to others, since family members shape the decision for most buyers.
- No signal yet: keep a strong default experience. Behavioural rules should add to it, never replace it.
Back to the buyer from Tuesday night. When they return, the site restores their saved build, shows the on-road price with an EMI estimate, and offers a test drive at a nearby dealer with the configuration attached.
How do you build the signal layer?
Build it in five steps: define the decisions, instrument the journey, unify the profile, activate in the interface, then review.
- Define the decisions. List the five interface decisions you want data to inform before choosing tools.
- Instrument the journey. Track configurator, calculator, locator and form events with one consistent schema.
- Unify identity and consent. Stitch anonymous and known activity into one customer profile, gated by consent.
- Activate. In the Adobe stack this typically means Adobe Analytics or Customer Journey Analytics for measurement, Adobe Experience Platform for the profile, and Adobe Target or Adobe Journey Optimizer for activation.
- Review monthly. Check which rules fired, what they changed and which should be retired.
How do you measure whether it works?
Measure movement between journey stages, and judge the end result on lead quality, not volume alone.
- Stage metrics: configurator completion, comparison-to-test-drive rate, calculator-to-enquiry rate and form completion.
- Outcome metrics: dealer acceptance of handed-over leads, test drive bookings and dealer-qualified lead rate.
- Holdout group: keep a share of visitors on the default experience so every gain can be attributed.
- Expected upside: McKinsey estimates personalization can lift revenue by 5% to 15% and marketing ROI by 10% to 30% (2023, cross-sector). Treat these as ranges to test against your own holdout.
- Run time: allow a full decision cycle before judging outcome metrics, since automotive decisions take weeks.
How do you handle consent and trust?
Behavioral design works only when buyers understand and accept how their data is used.
- Collect on a consent-led basis, in line with India's Digital Personal Data Protection Act, 2023.
- Tell buyers what a saved build or preference stores, and give them a visible way to reset it.
- Avoid inferring sensitive attributes from behavior.
- Keep rules simple enough to explain to a customer, a dealer and a regulator.
- Bring legal and security teams into signal definition early.
Key takeaways
- Data-driven UX uses live buyer behavior to decide what the interface shows next.
- Car buying is non-linear: 63% of recent Indian buyers decided their brand during active research, so every touchpoint carries signal.
- Configurator, comparison, calculator and dealer locator signals reveal stage and intent best.
- Link every signal to one agreed interface change, and keep a strong default for visitors with no signal.
- Measure stage-to-stage movement with a holdout group, then judge lead quality over a full decision cycle.
- Build consent and transparency into the design from the start.
Work with Axeno
Ready to turn buyer behaviour into interface decisions? Axeno designs and runs behaviour-led journeys for automotive brands on Adobe Experience Cloud.
Frequently Asked Questions
What is data-driven UX in automotive?
Data-driven UX uses observed buyer behavior, such as comparisons, configurator use and calculator activity, to decide what the interface shows next. For automotive brands it shapes content order, calls to action and dealer handoff, so each visitor sees a next step that matches their stage rather than a generic homepage.
How is data-driven UX different from A/B testing?
A/B testing compares two fixed designs and picks a winner for everyone. Data-driven UX adapts one design to each visitor's behavior. The two work together: testing validates each behavioral rule, and a holdout group of visitors who see the default confirms the adapted experience performs better over a full decision cycle.
Which behavioral signals should we start with?
You need a way to unify anonymous and known behavior into one profile and activate it in the interface. Adobe Experience Platform is one option for Adobe stacks. Smaller program can begin with analytics events and a few rules in a personalization tool, then add a unified profile as use cases grow.
How do we stay compliant with India's data protection law?
Use consent-led data collection, explain what is stored and why, and let buyers reset saved builds and preferences. Avoid inferring sensitive attributes from behavior. Involve legal counsel when defining signals, since obligations under the Digital Personal Data Protection Act, 2023 depend on how data is collected and used.
How long before we see results?
Stage-level metrics such as configurator completion and calculator-to-enquiry rate tend to show movement first, while test drive bookings and qualified leads need a full decision cycle to judge. Use a holdout group from the first day of launch so every improvement can be attributed to a specific rule.
-1.png)